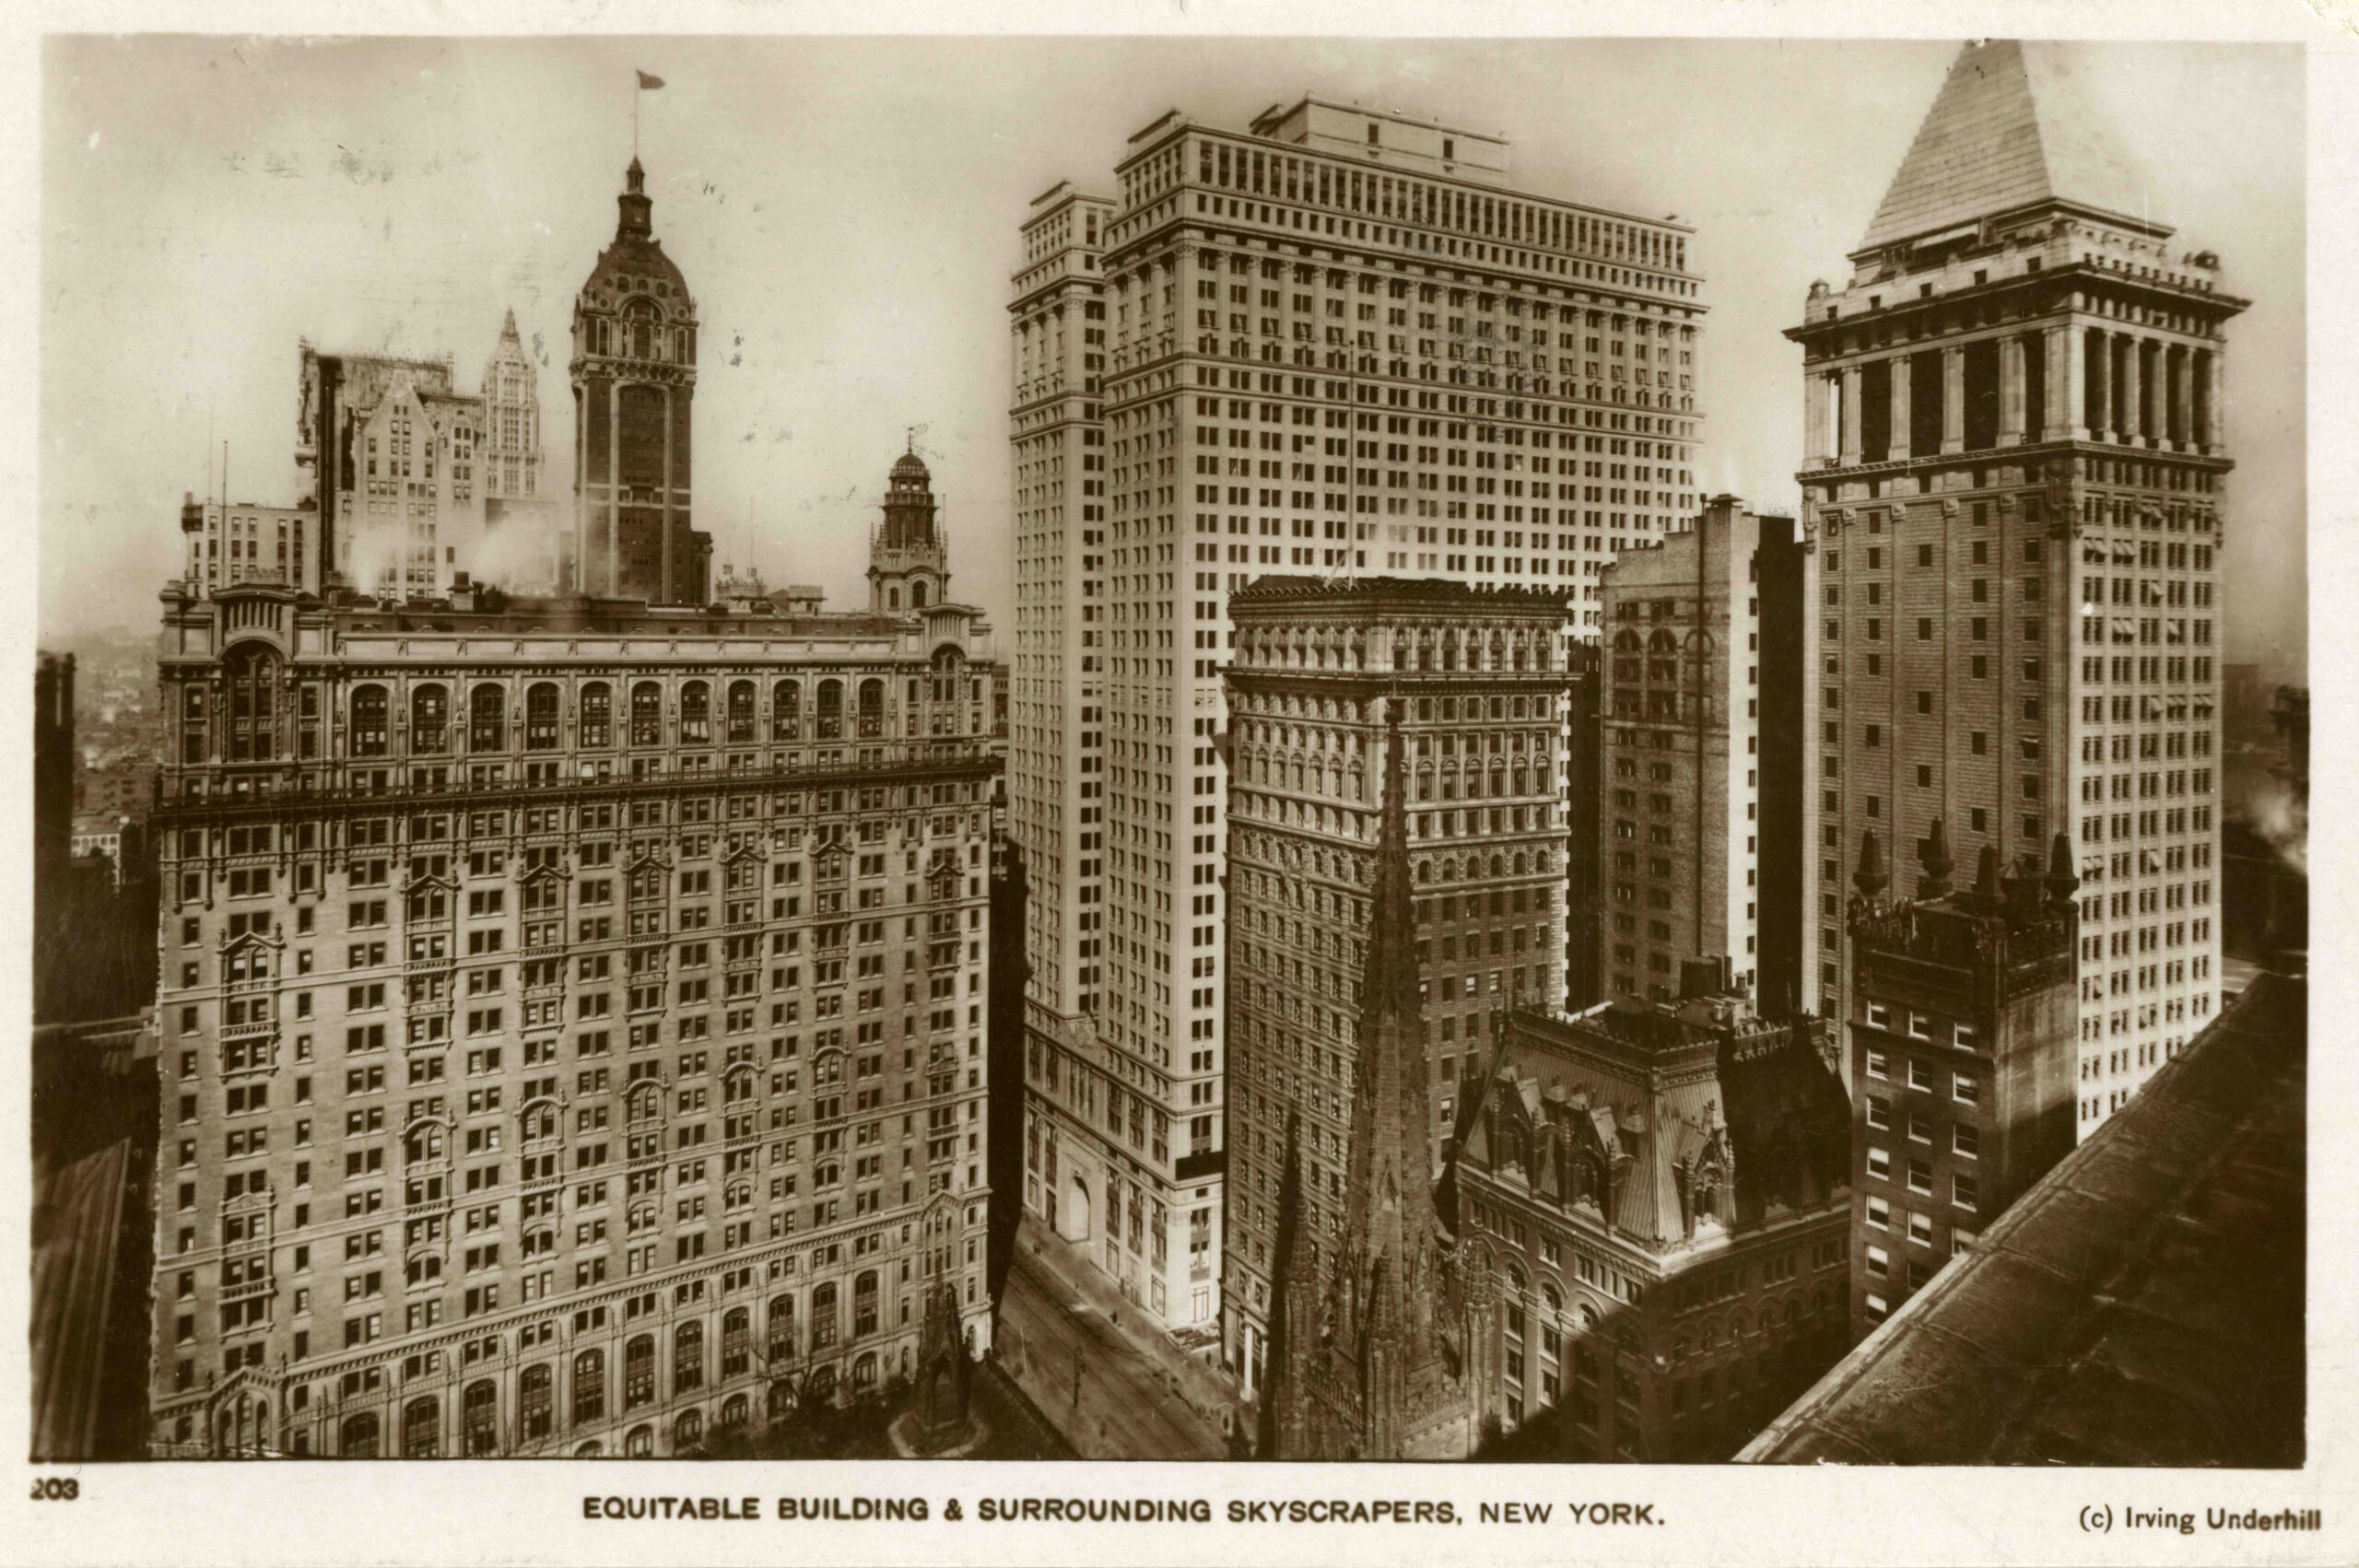
SKYLINE THROUGH, 1916
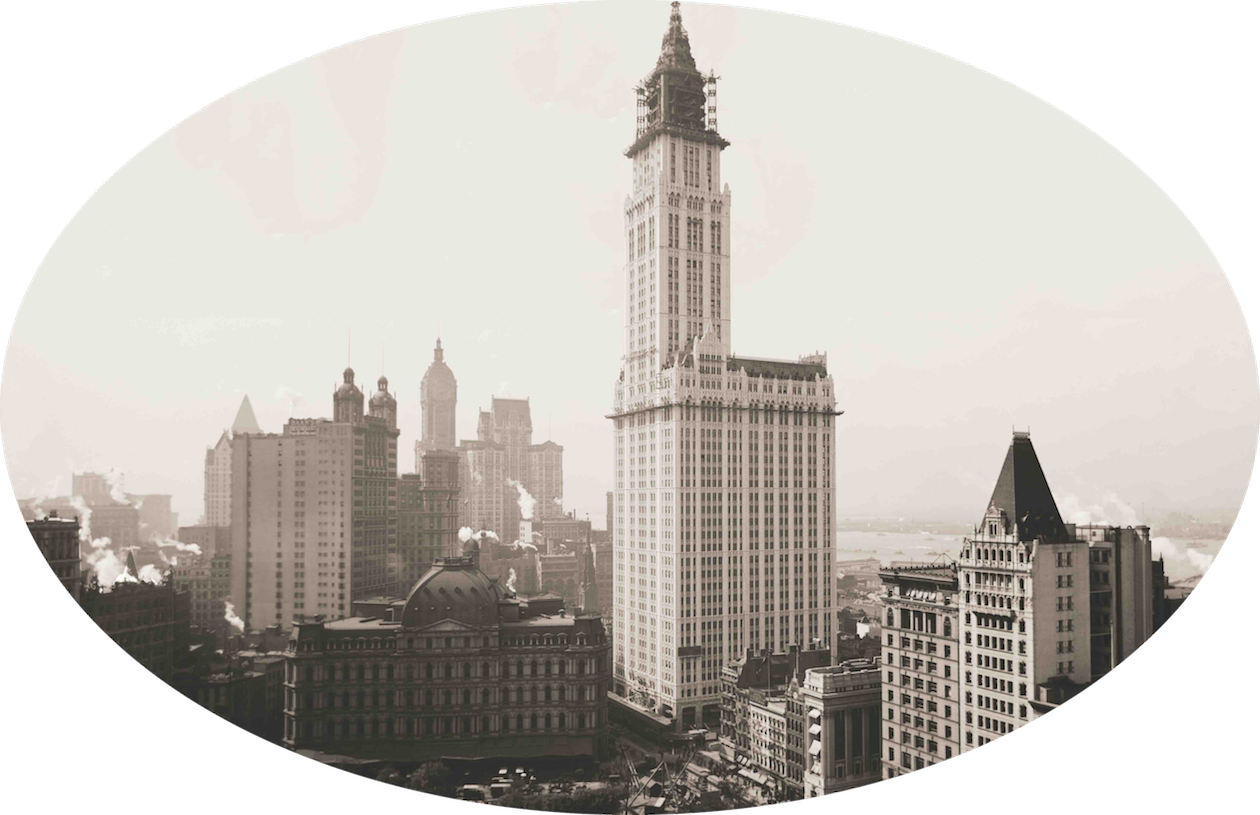
The scale of buildings increased dramatically after 1900, especially in the years from 1908 to 1916, as this third skyline panorama, also by Irving Underhill, illustrates. A series of record-breaking towers vied for attention. Completed in 1908, the Singer Building (at center) lifted its slender shaft to 612 feet, finally surpassing the turn-of-the-century Park Row Building and besting it by more than 200 feet. In 1909, the Metropolitan Life Insurance Company Tower, located uptown on Madison Square, topped out at 701 feet. The title returned to downtown in 1913 with the completion of the Woolworth Building, which soared 792 feet to the tip of its spire. Woolworth remained the world’s tallest office building until the Chrysler and Empire State buildings topped out in 1929 and 1931, and still ranked as fifth tallest in the city until One Chase Manhattan Plaza was completed in 1961.
These skyscrapers were exceedingly ornate and expensive ventures. They carried the names of their companies, which were among the largest in the U.S., and their stature on the skyline helped advertise their success. While the buildings served as corporate headquarters, they were also real estate investments in a competitive rental market. Both the Singer and Woolworth companies kept only executive offices in their name-brand buildings: in the 55-story Woolworth, only one and a half floors were occupied by the company, while the other floors were leased to more than a thousand tenants, according to 1914 rent rolls.
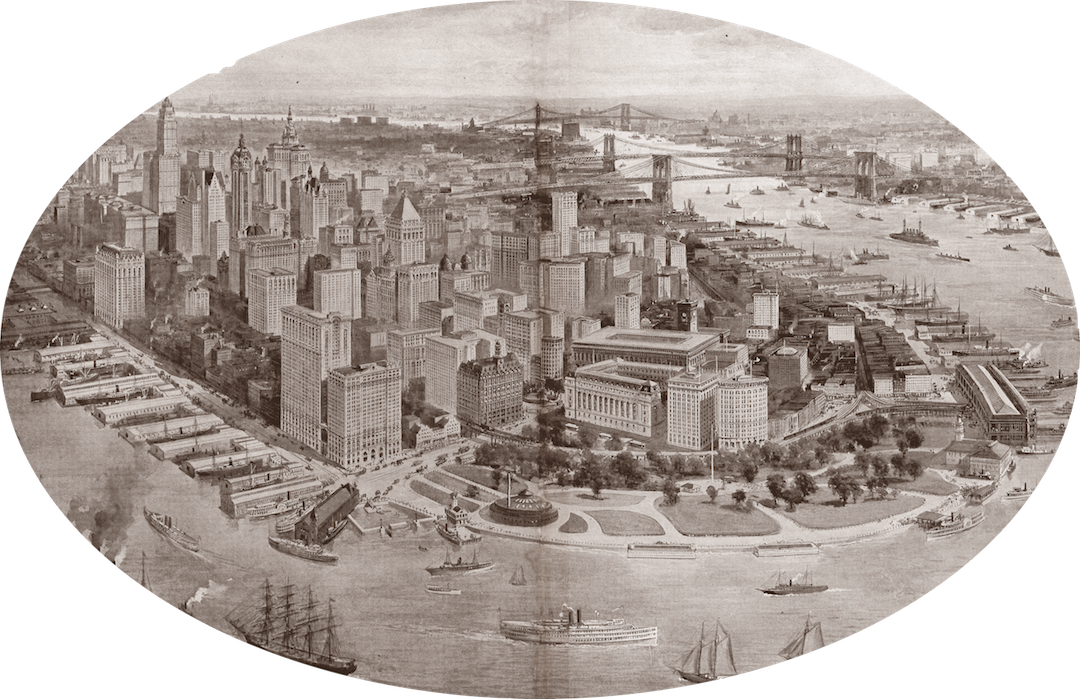
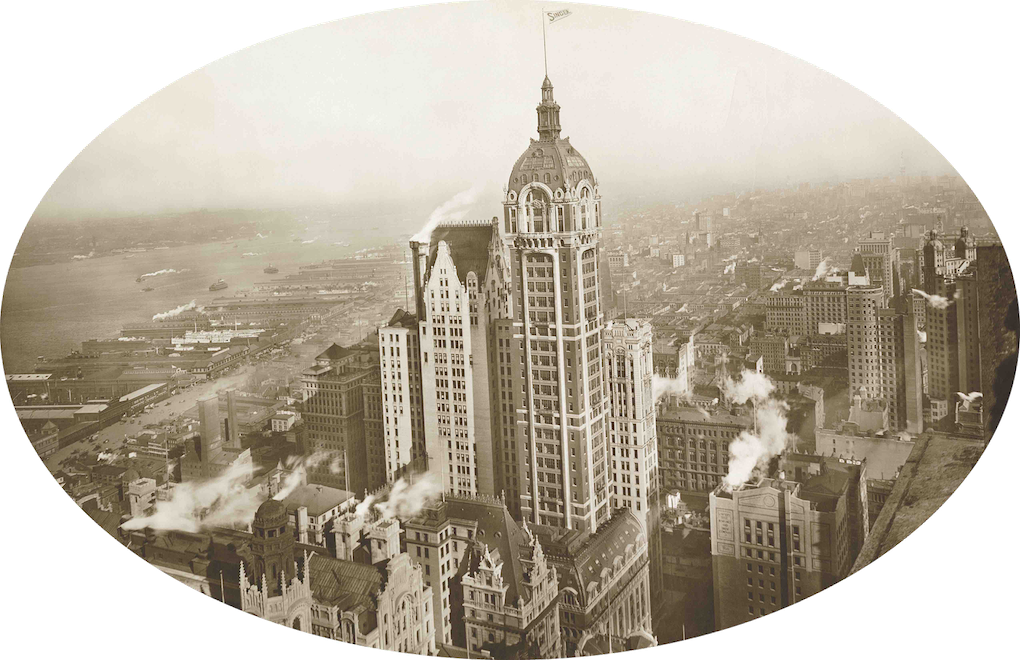
Overall size, measured by total floor space rather than by height, was the other dimension of unprecedented growth in these years. Rising on the same city block as the Singer Tower in 1908 was the City Investing Building, which with 559,000 square feet was briefly the largest office building in the world. It was surpassed in quick succession by the Hudson Terminals complex in 1909; the Municipal Building in 1914; and in 1915, the flat-topped, 33-story block of the Equitable Building at 120 Broadway. At just 542 feet, it loaded 1.2 million square feet onto the downtown rental market. Big buildings added acres of office space to lower Manhattan, creating the largest central business district in the world.
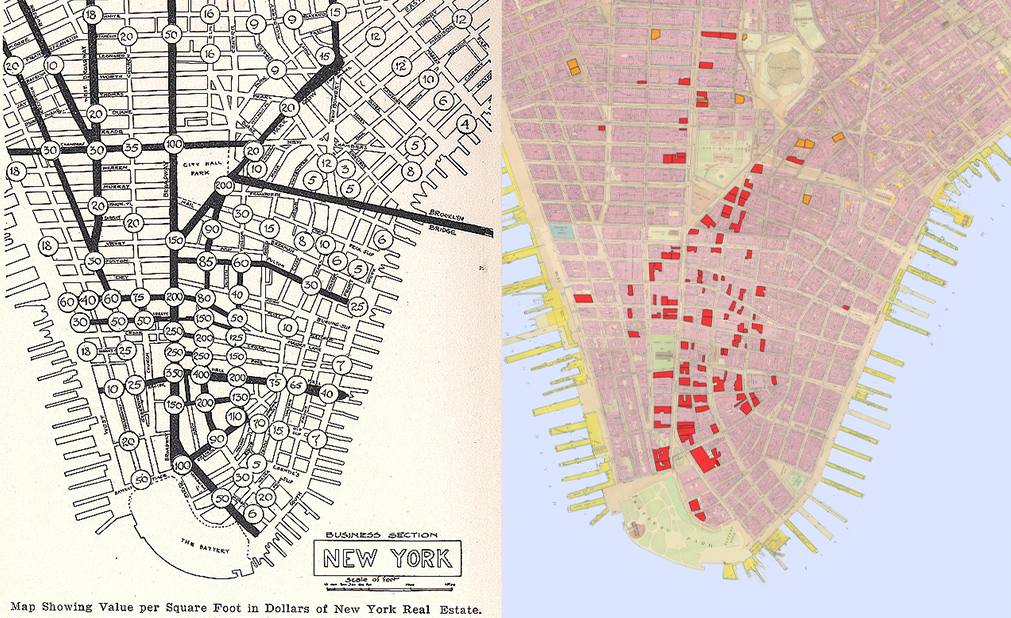
The absence of municipal restrictions on the height or bulk of commercial buildings was the key factor in the development of the Manhattan skyline from the time of the first towers in the 1870s until the enactment of zoning in 1916. The laissez-faire environment and demand for the best locations created the tall, high-value corridor of Broadway and shaped the mound of buildings that crowded into the blocks around Wall and Broad streets and surrounding City Hall Park. This 3D expression of land values was reflected in the sales price of land per square foot, as can be seen in the map created in 1903 by economist Richard Hurd, illustrated in an oval above. This map shows the extraordinary range of values in very close proximity in lower Manhattan: for example, land on Wall Street near Broadway was valued at $400 per sq. ft., while a few blocks west, prices plummeted to $10 per sq. ft. The oft-repeated idea that Manhattan’s skyscrapers “grew upwards” because there was no room to expand out is contradicted by ’s map. There was space to build tall away from the business center, but few desired to rent there.
