RESIDENTIAL RISING: Lower Manhattan since 9/11
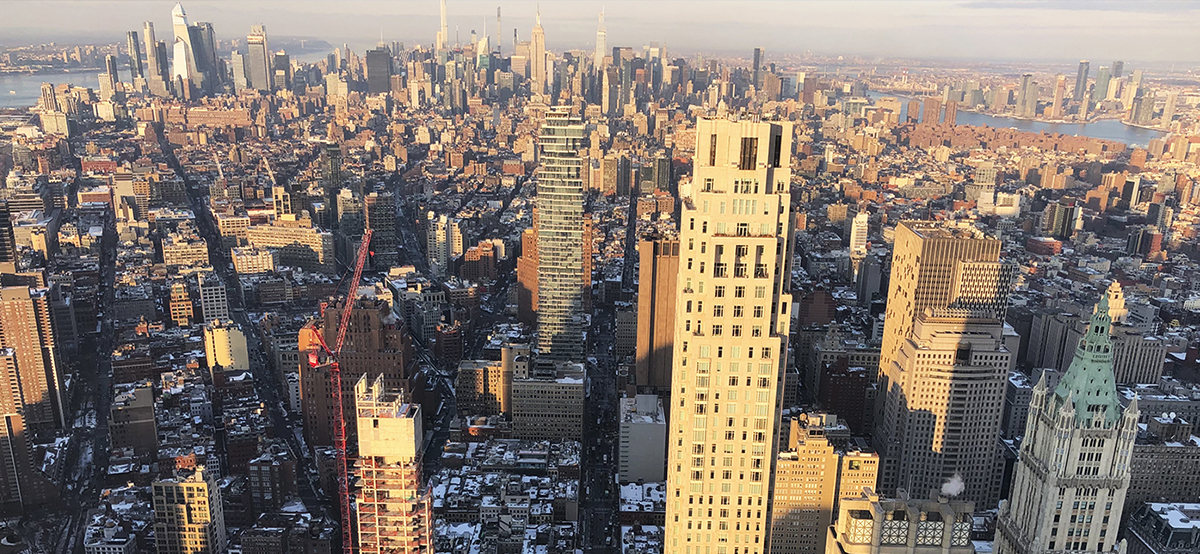
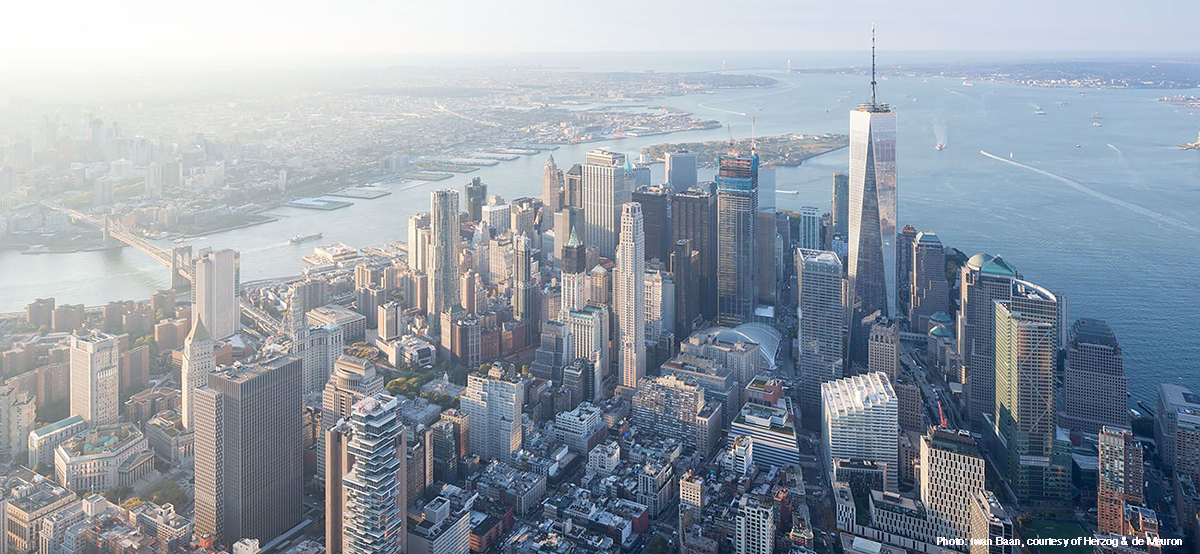
Beyond the boundaries of Ground Zero, the most significant change in the lower Manhattan skyline since 9/11 has been the new growth of residential skyscrapers. The southern tip of the island has sprouted a bevy of conspicuous, competitive, and highly individualistic towers. Very tall and generally slender, as befits the development strategy of luxury condos, many are designed by acclaimed architects whose celebrity adds marketing value. Eclectic in form and façades, there is no consistent style that marks them of their moment – yet their very presence in the skyline connects them to the monumentally significant events of 9/11.
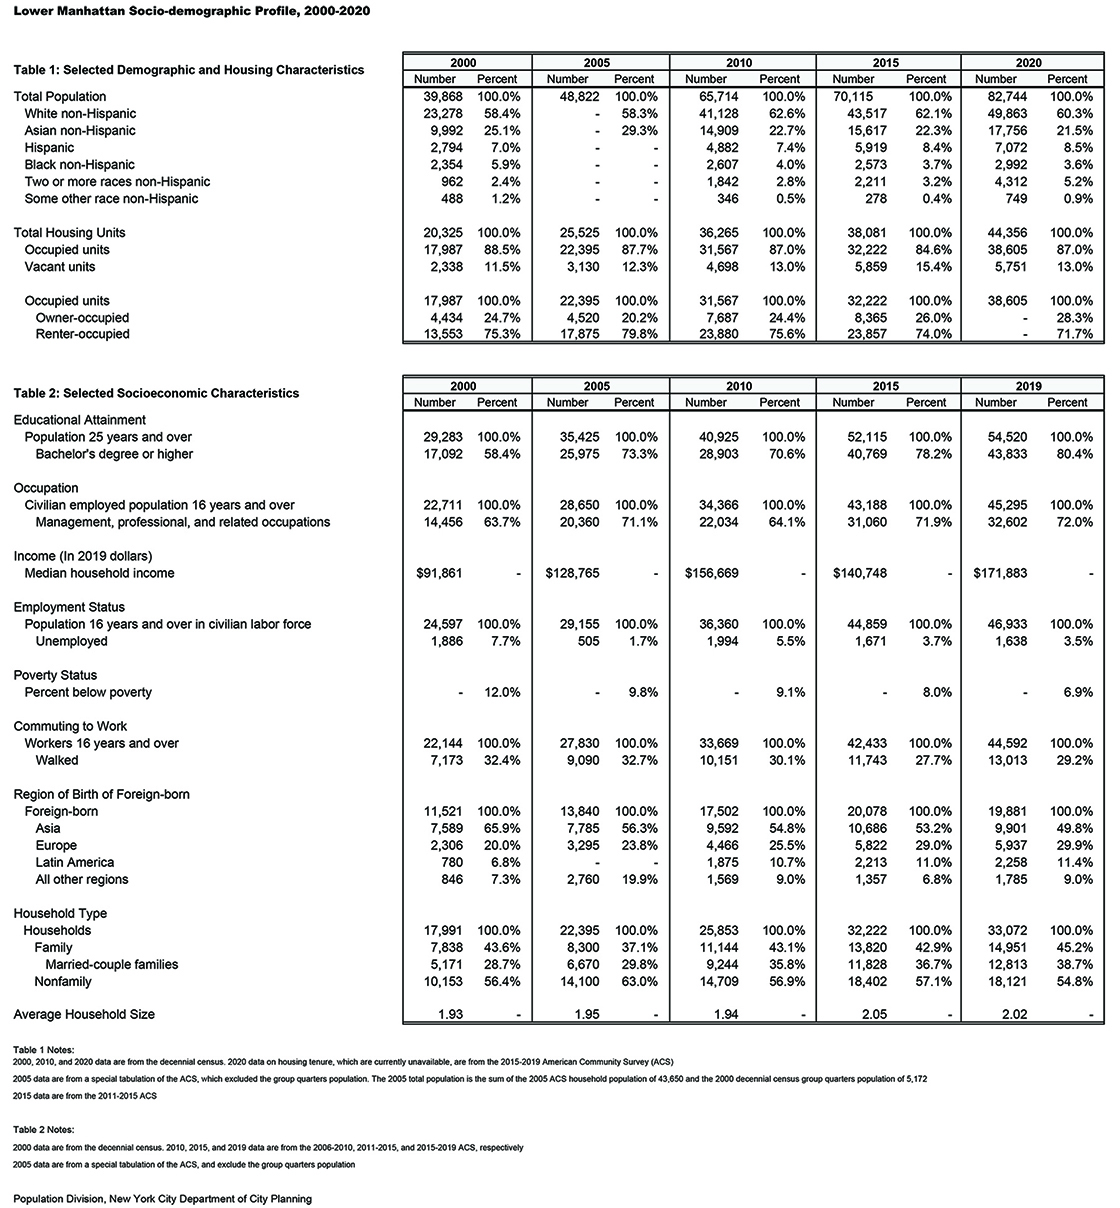
Downtown’s evolution into a mixed residential neighborhood – which was initiated by the City in the mid-1990s, but catastrophically interrupted in 2001, as well as by the financial crisis of 2008 and Superstorm Sandy in 2012 – has doubled the residential population without drastically altering the historic urban fabric. A key dynamic of change has been the conversion of older office buildings into apartments – ranging in character from iconic landmarks such as the Woolworth Building and One Wall Street to back-office glass boxes of the 1960s and 70s. The population of lower Manhattan, which was 39,000 in 2000, now tops 82,000 residents.
In the wake of 9/11, lower Manhattan faced daunting challenges of rebuilding and reinvention that were met through adaptive reuse, government incentives for density, and valuing historic preservation, as well as new construction – a hopeful model of transformation for our COVID-recovery era.


Residential Rising: Lower Manhattan, 2000-2022
Downtown has slowly been evolving into a mixed residential neighborhood, realizing policies initiated by the City in the 1990s as the businesses of the financial district were shifting to new locales. In 2000, lower Manhattan had a daytime working population of 400,000 and fewer than 40,000 residents in 20,300 dwelling units. Today, the residential population has more than doubled to 82,000 in 44,300 units. Surveys show that around 80 percent of downtown residents live in high-rise buildings.
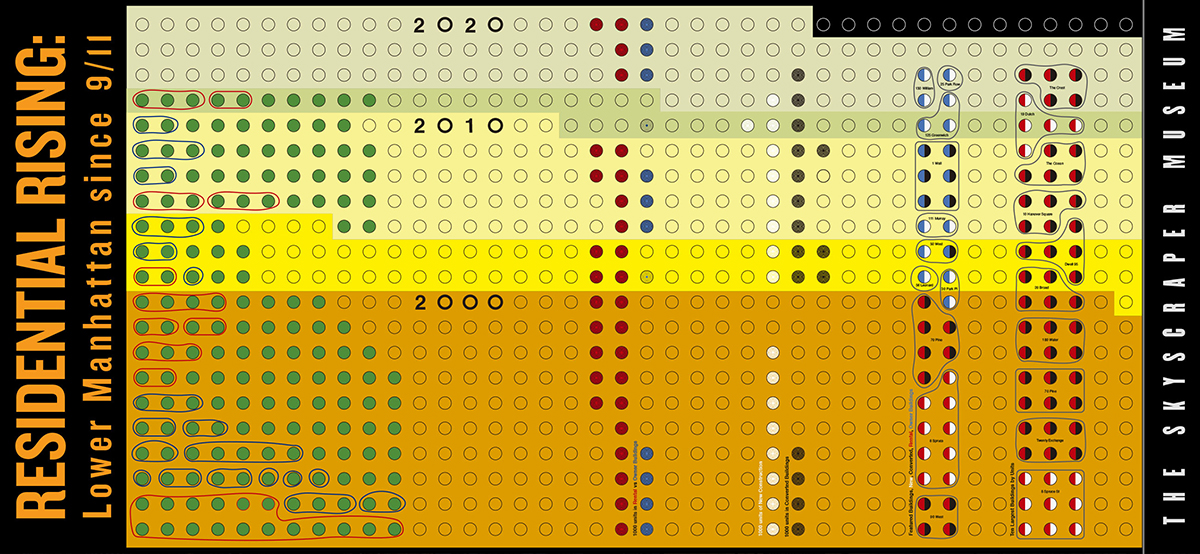
While the core of the exhibit focuses on the exceptionally tall, high-design projects, this section analyzes the broader demographics of lower Manhattan and illustrates its growing population and number of dwelling units. The super-graphic presents a color field and grid of 840 dots that simultaneously encompass a range of comparisons of people, units, and buildings.
According to the decennial U.S. Census, in the year 2000, there were 39,868 residents of lower Manhattan in the area illustrated on our map. The orange background underlying the dots (where one circle equals 100 people) grounds that base line population for our study. The other background colors “fill up” the chart to present-day population of nearly 83,000 residents in layers that relate either to numbers recorded by the decennial U.S Census or the American Community Survey (ACS).
On the left side, green dots stand for residents of Battery Park City, who make up about 20 percent of all downtown dwellers. They live in just thirty buildings, which are indicated by lines that encircle a number of dots (inside the lines each dot equals 100 apartments).


Across the rest of the graphic, other dots, when coded by color, signify 100 dwelling units. RED signifies RENTAL and BLUE is OWNED (condo or coop). WHITE represents NEW buildings and BLACK, older buildings CONVERTED to residential use.
In the two columns at the center, the dots are composed of 10 concentric circles, thus 1,000 units per dot. They show the number of units in either RENTAL versus OWNED, or NEW or CONVERTED buildings. Using the area and data from the Downtown Alliance, about 12,000 units had been converted to residential versus around 9,000 units added in new buildings since 2000.
The two columns on the right represent the twelve featured buildings and the ten largest buildings in our area. One dot equals 100 apartments and the encircling dots show the building’s size.
The colors indicate the RENTAL, OWNED, NEW, or CONVERTED. So, for example, of the ten largest buildings in terms of units, only two are NEW construction and all are RENTAL. The featured towers include both new construction and conversions, but only total about 3,800 units.
The map shows the area of the population survey in gray. The red boundary outlines the area of the Downtown Alliance survey of residential buildings and units.
")

The data for the charts were provided by the New York City Department of City Planning, Population Division. The Museum is grateful to Arun Peter Lobo and his team for extending the data from a 2007 published paper, “A Pre- and Post-9/11 Look (2000-2005) at Lower Manhattan” Population Division, New York City Department of City Planning.
In general, the neighborhoods of lower Manhattan are significantly richer than the city average, with a Median Household Income of nearly $172K – almost twice the $92K in 2000. While the racial mix has remained quite consistent over the past two decades, the dominant groups are white and Asian, which together represent 71 percent of residents. Education levels are also very high, with 80 percent of the population holding a college degree.
Map of Featured Buildings and Twelve Largest Buildings by Units
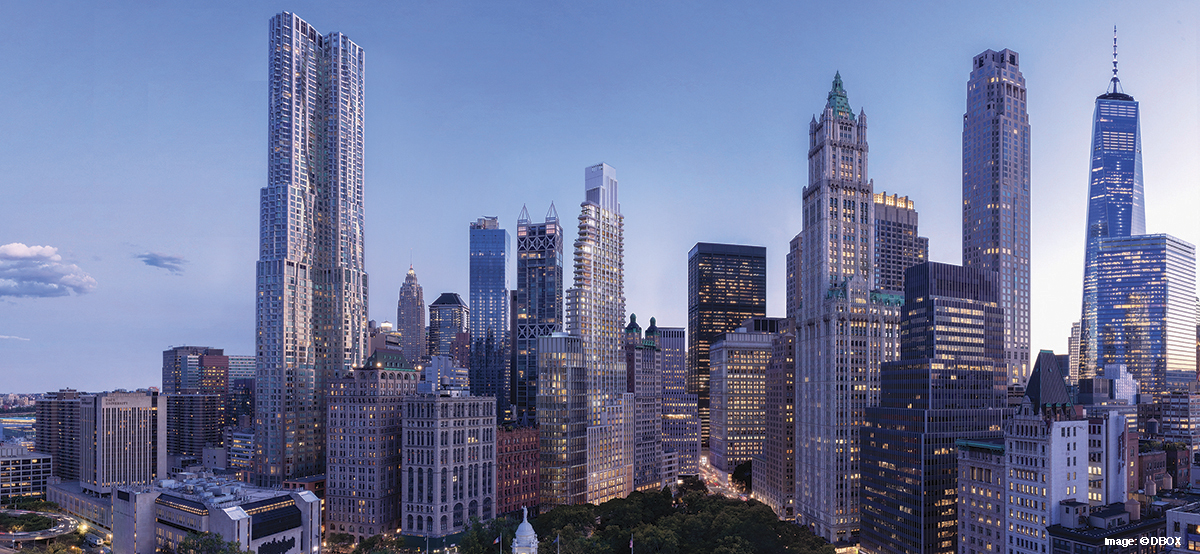
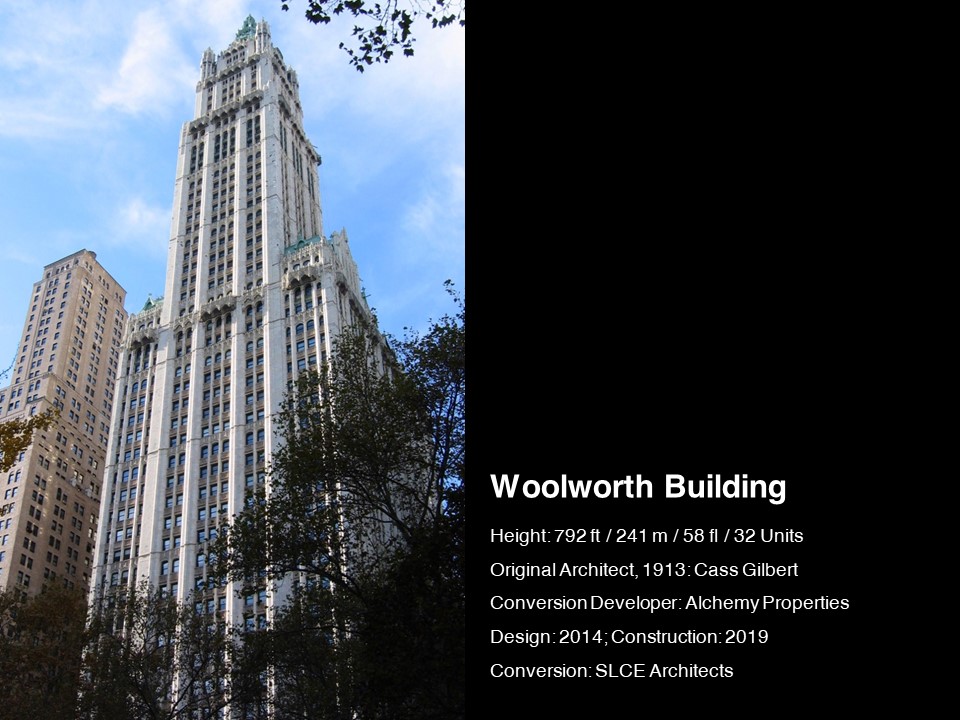
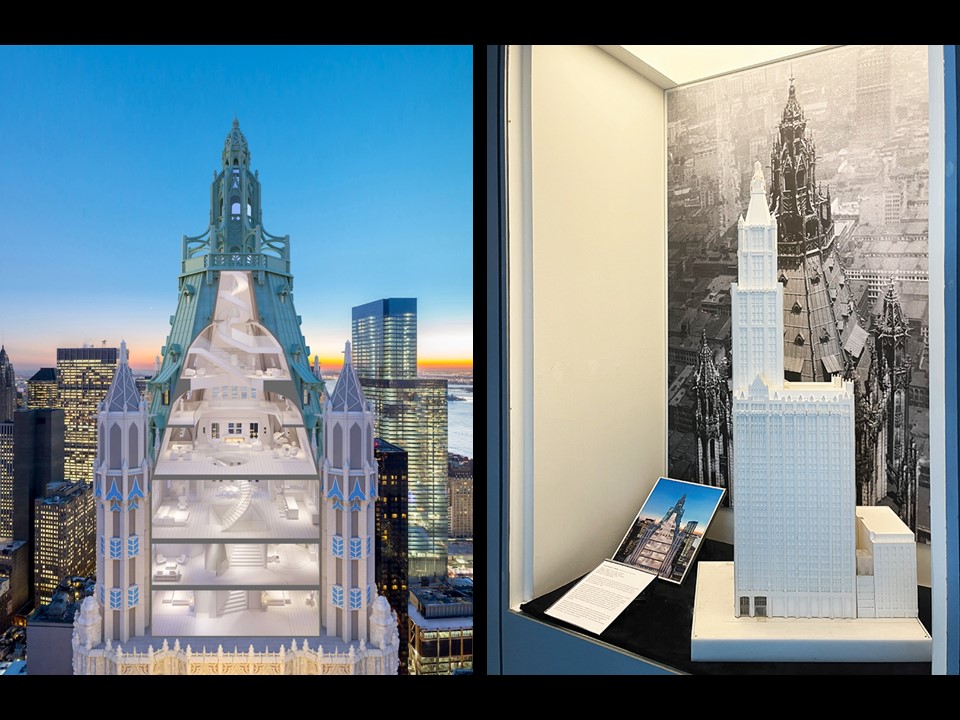
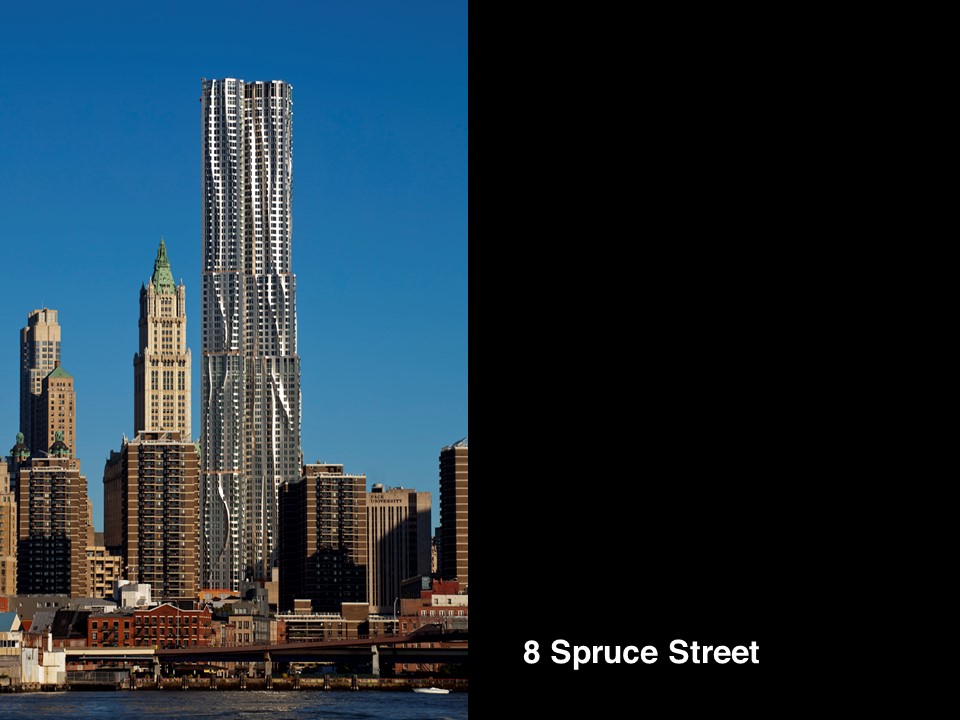
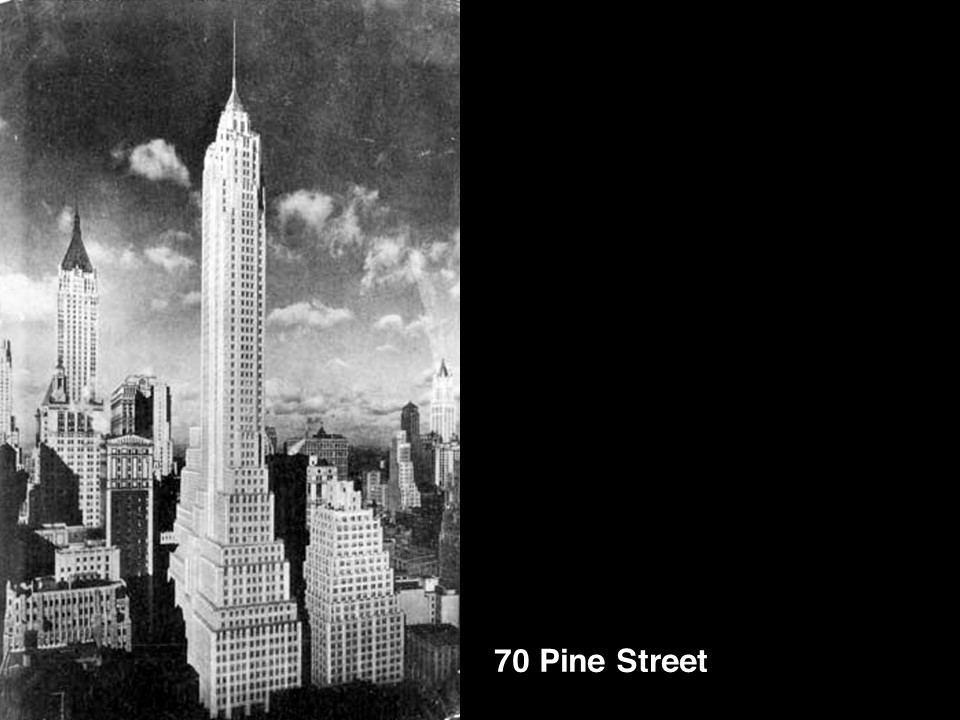
The exhibition examines two types of residential projects: new and conversions. The featured buildings are, for the most part, new construction, as well as condominiums, although four – One Wall Street, the Woolworth Buildings, 90 West Street, and 70 Pine Street – are converted landmarks.. Not pictured, but included on the map, are 90 West Street (11) and the Woolworth Tower/2 Park Place (12). Appearing in both categories are 8 Spruce Street(1/A) and 70 Pine Street (C/13).
As a point of comparison and to understand what sort of projects produced the most dwelling units, we list the ten largest apartment buildings in our mapped area. Only two of these are new construction: 8 Spruce Street (1/A) and 19 Dutch (I). The conversion of aging office buildings to apartments was key to the doubling of Downtown’s population. In total, since 2000, 59 buildings were converted, adding about 12,009 units to the housing supply.


Featured Buildings
As numbered on the map.
All are NEW except 3 conversions; 2 are RENTAL .
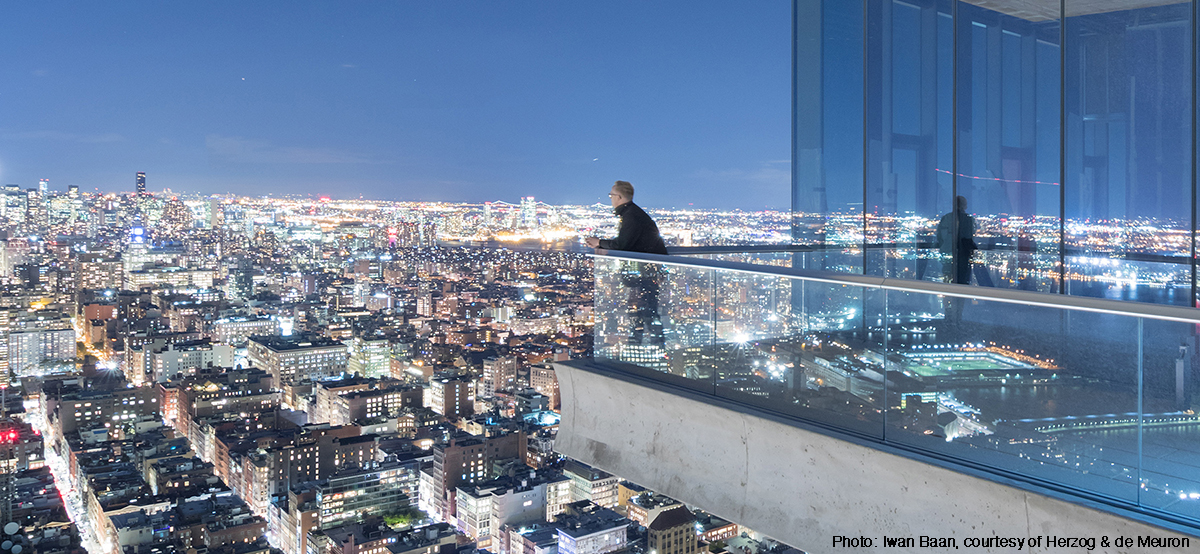
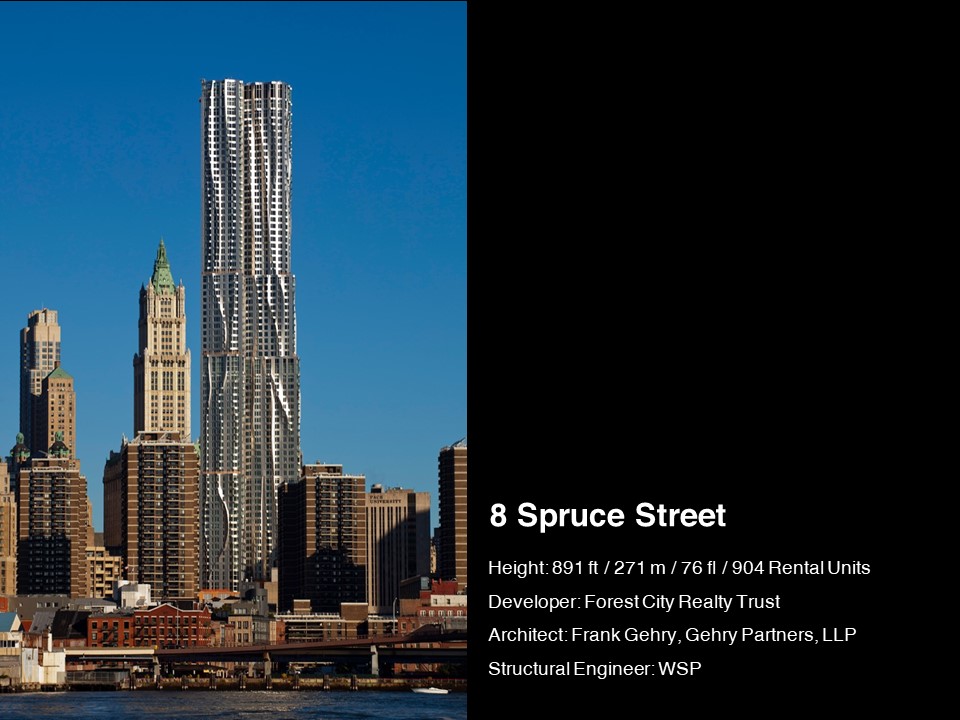
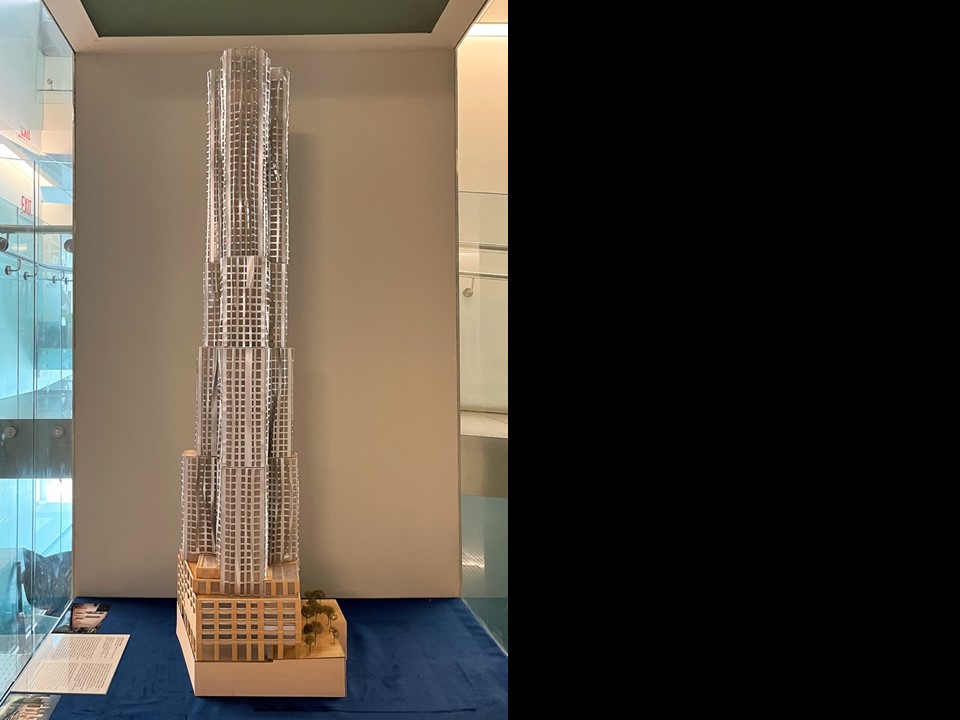
1. 8 Spruce Street 904 units RENTAL 2011
2. Visionaire 247 units 2008
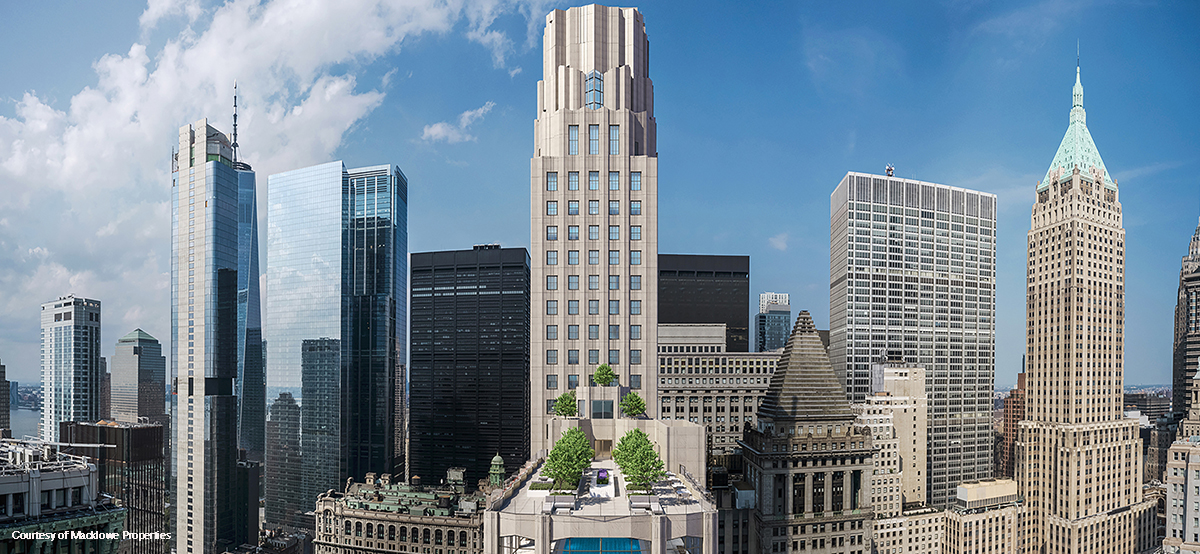
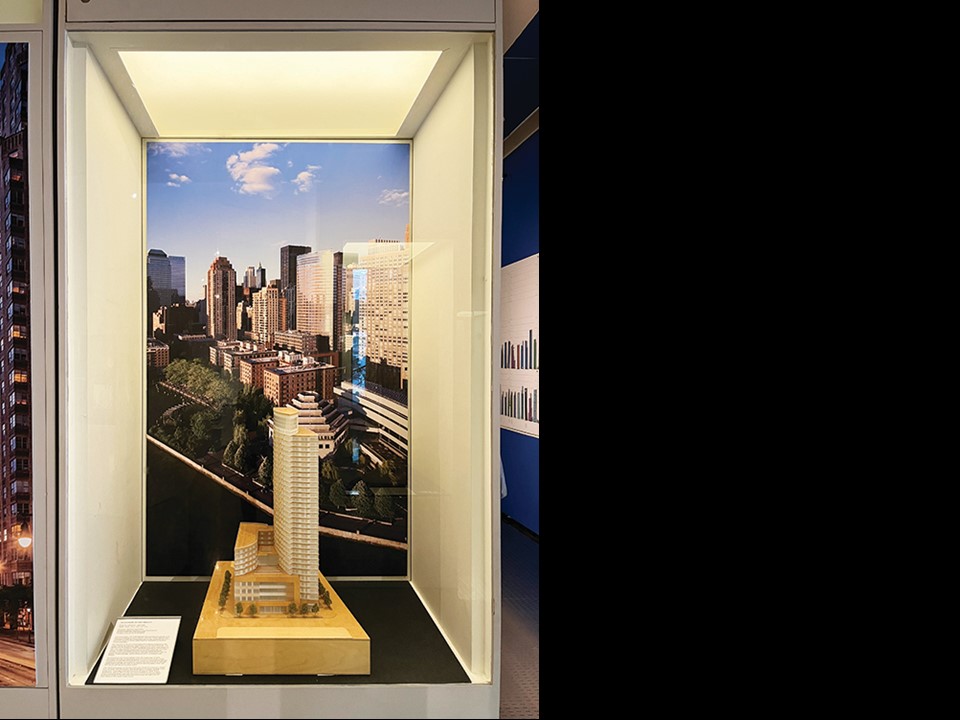
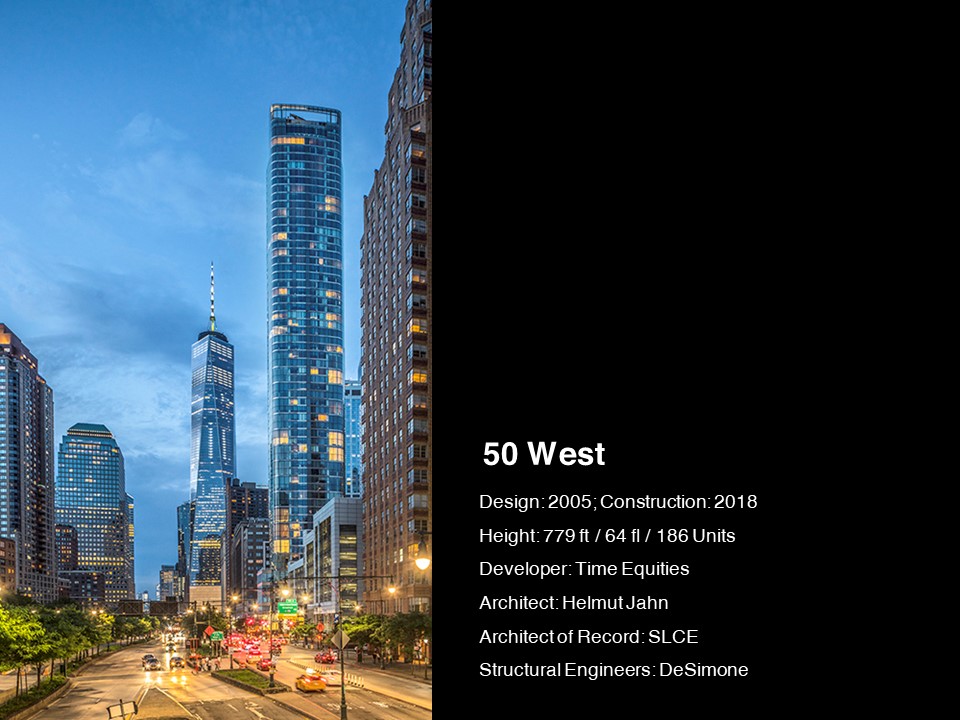
3. 50 West St. 86 units 2018
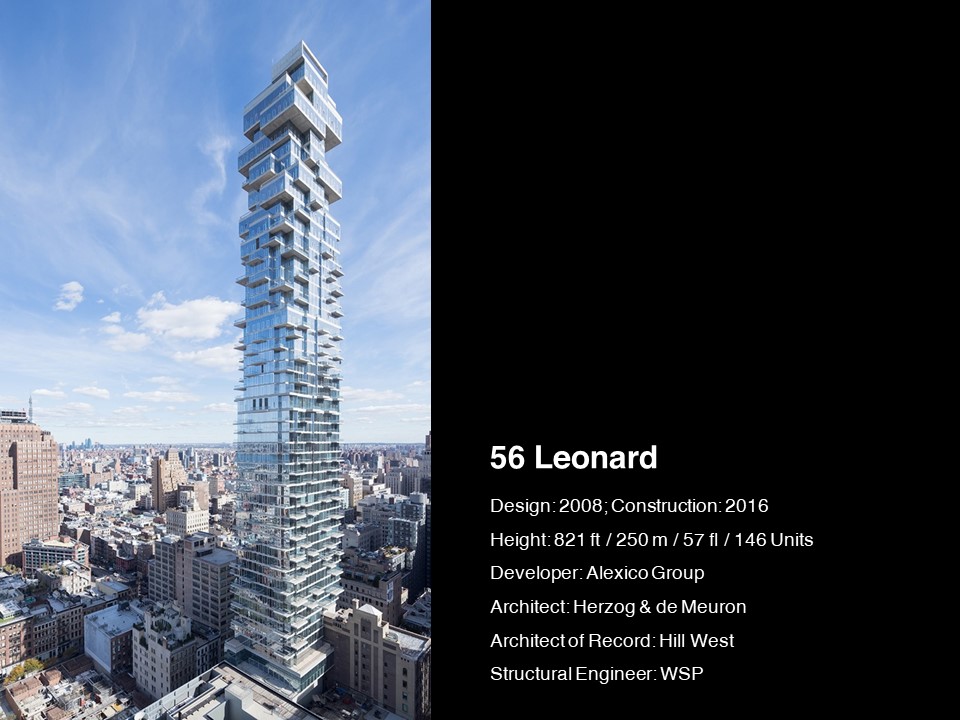
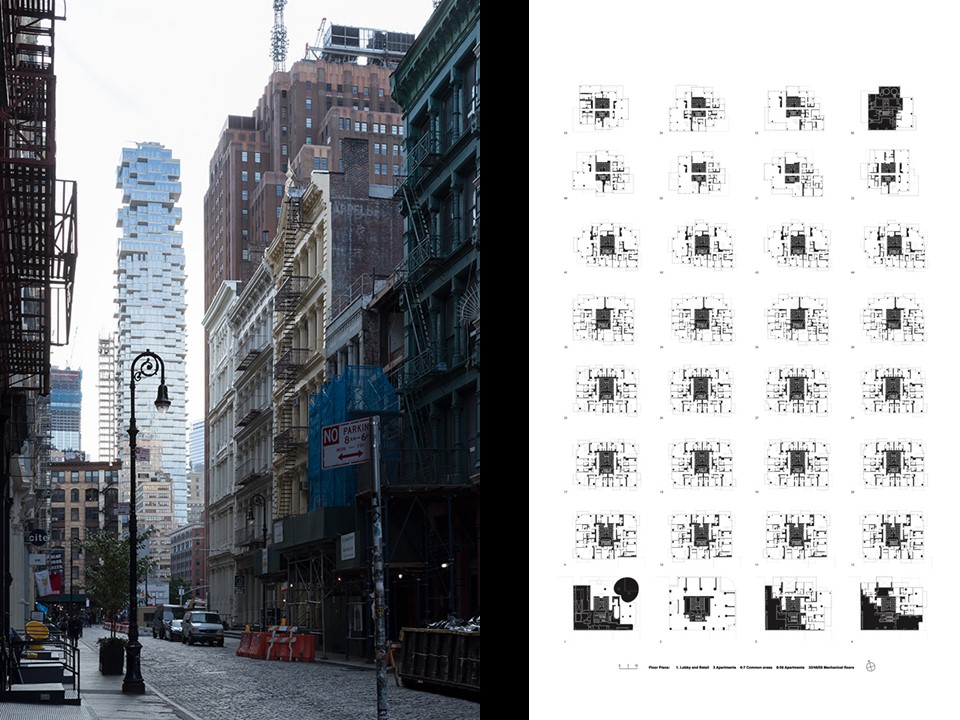
4. 56 Leonard 146 units 2016
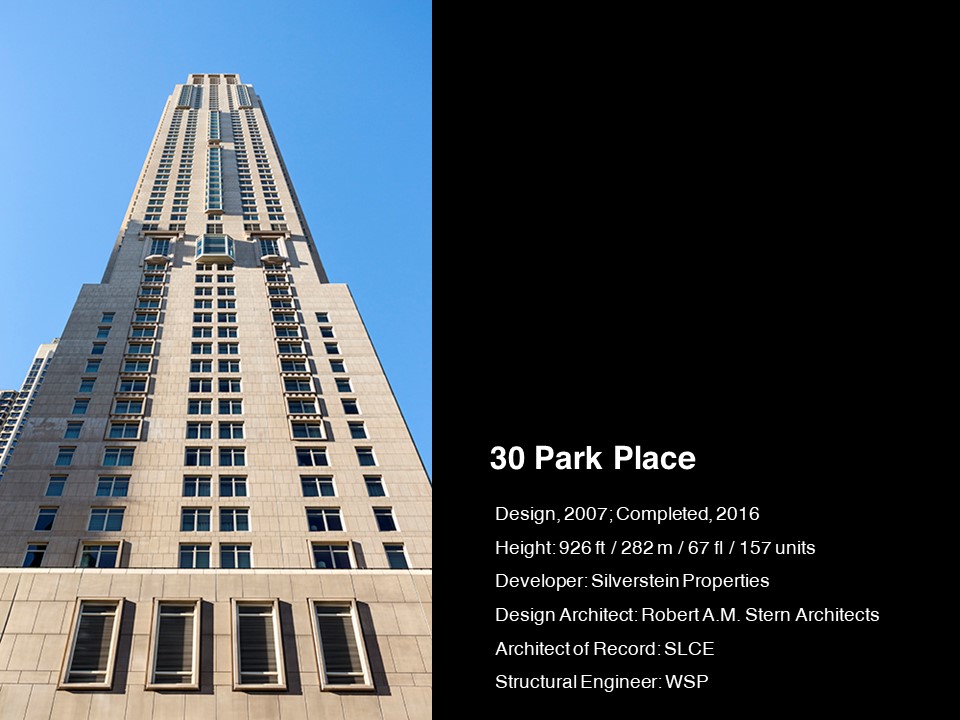
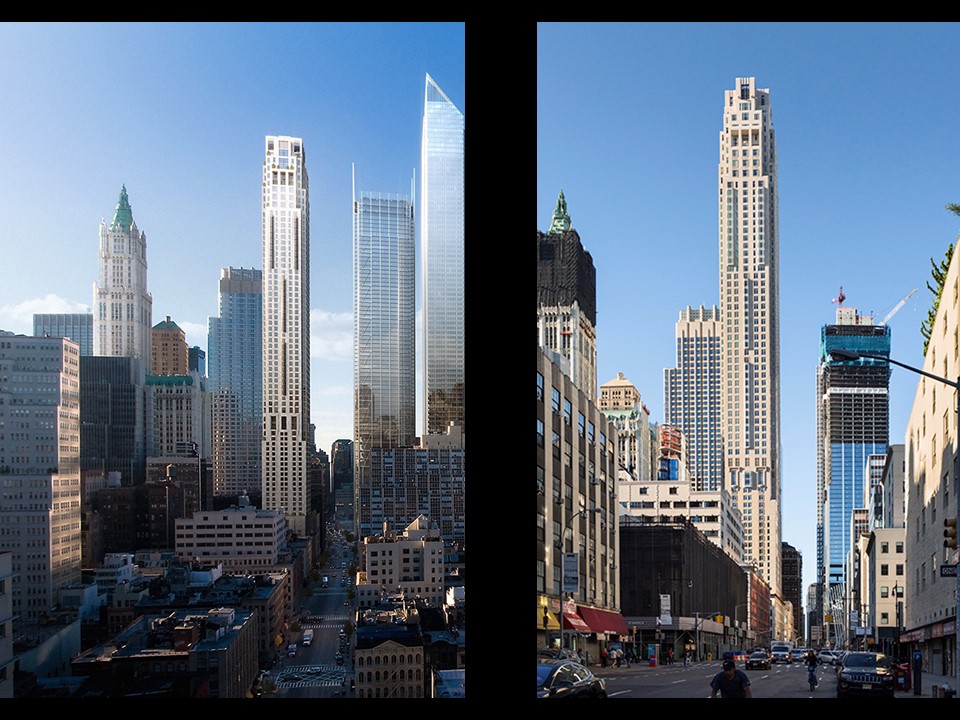
5. 30 Park Place 157 units 2016
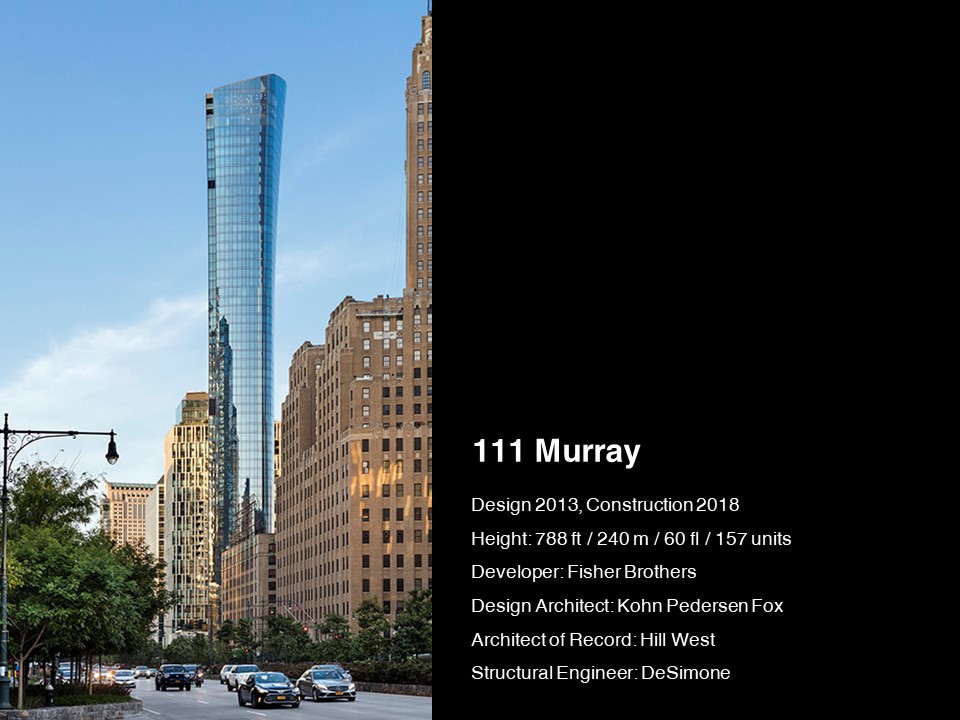
6. 111 Murray 157 units 2018
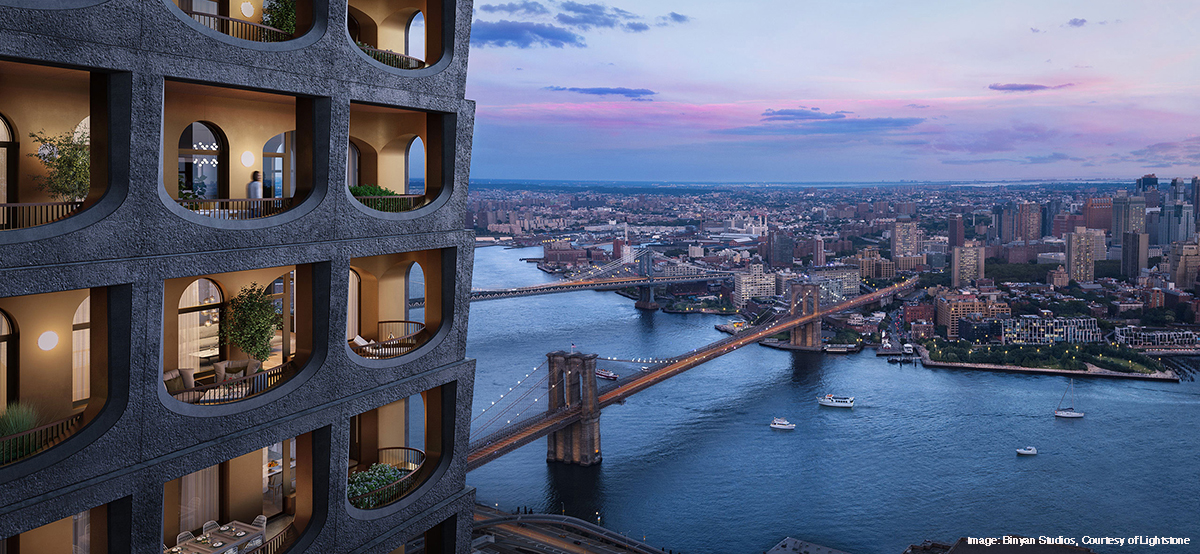
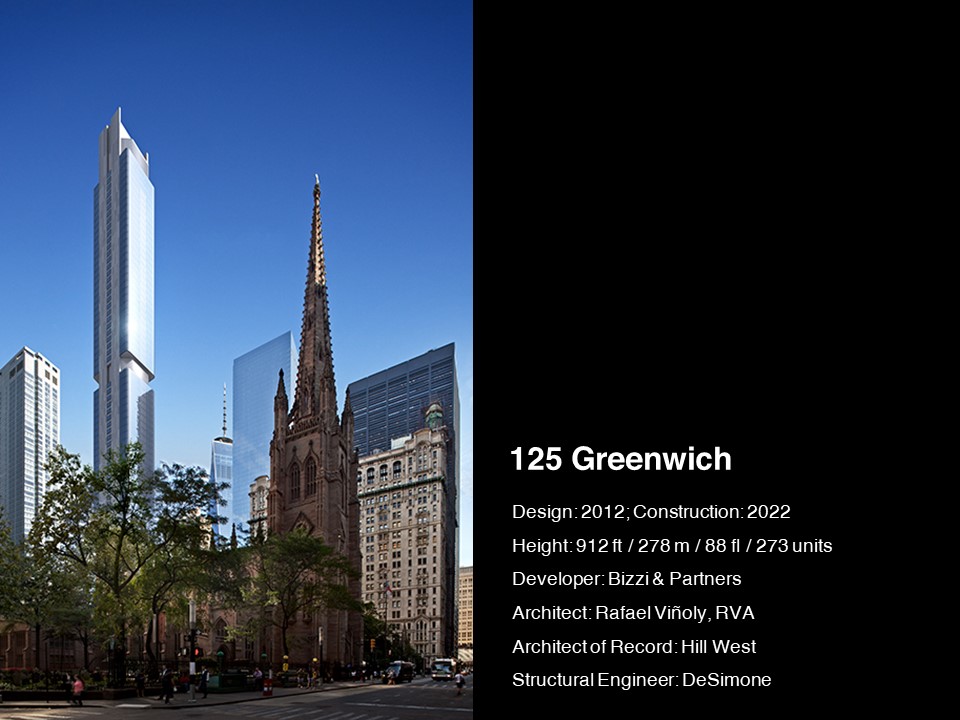
7. 125 Greenwich 273 units 2022
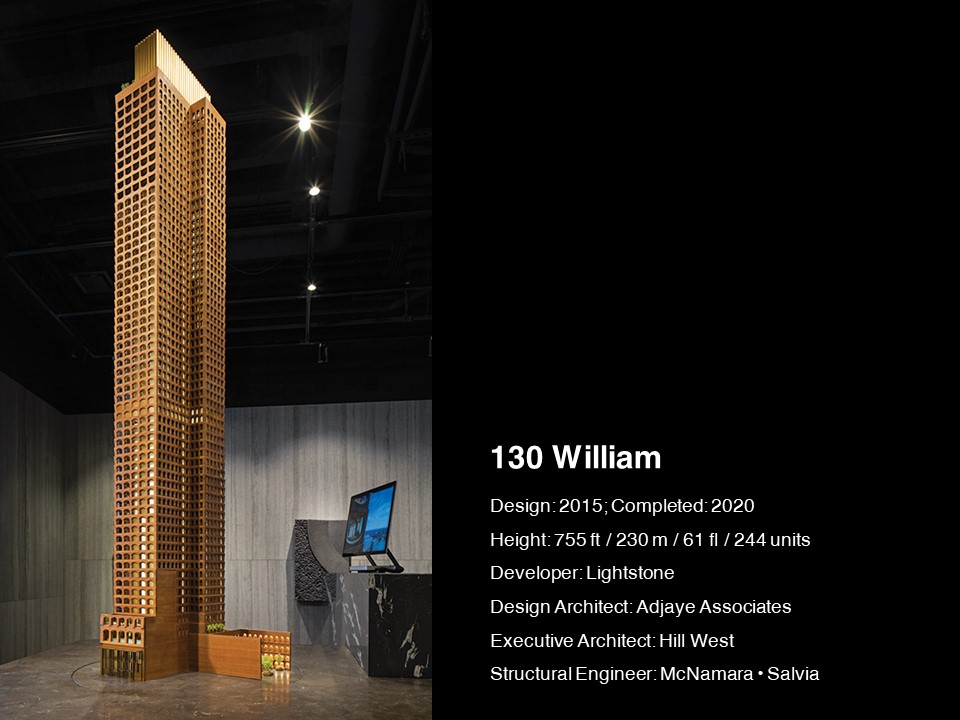
8. 130 William 244 units 2020
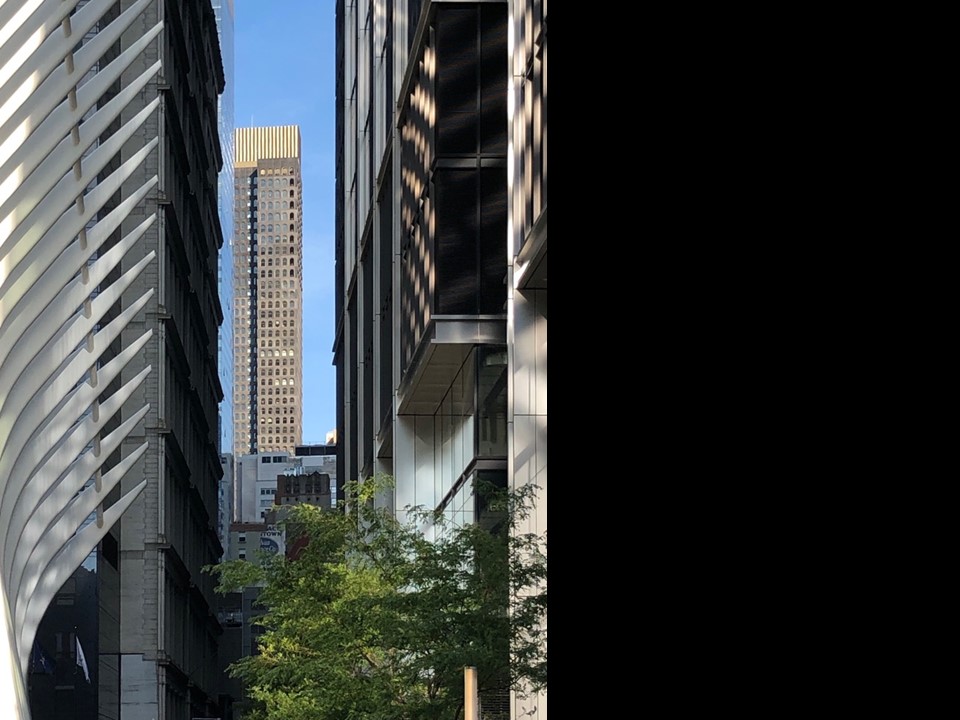
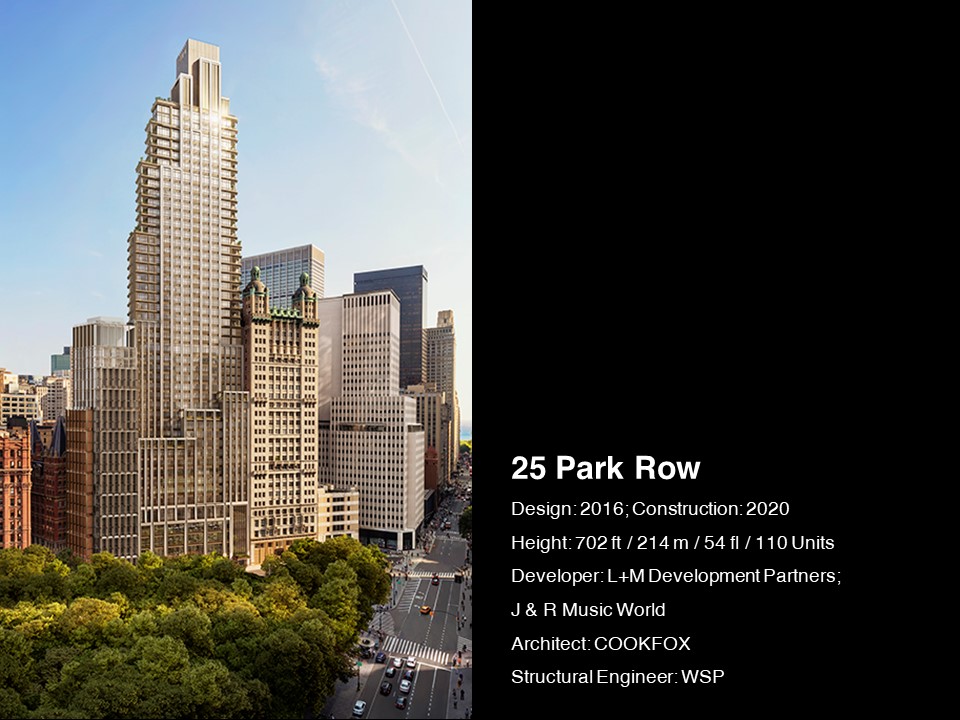
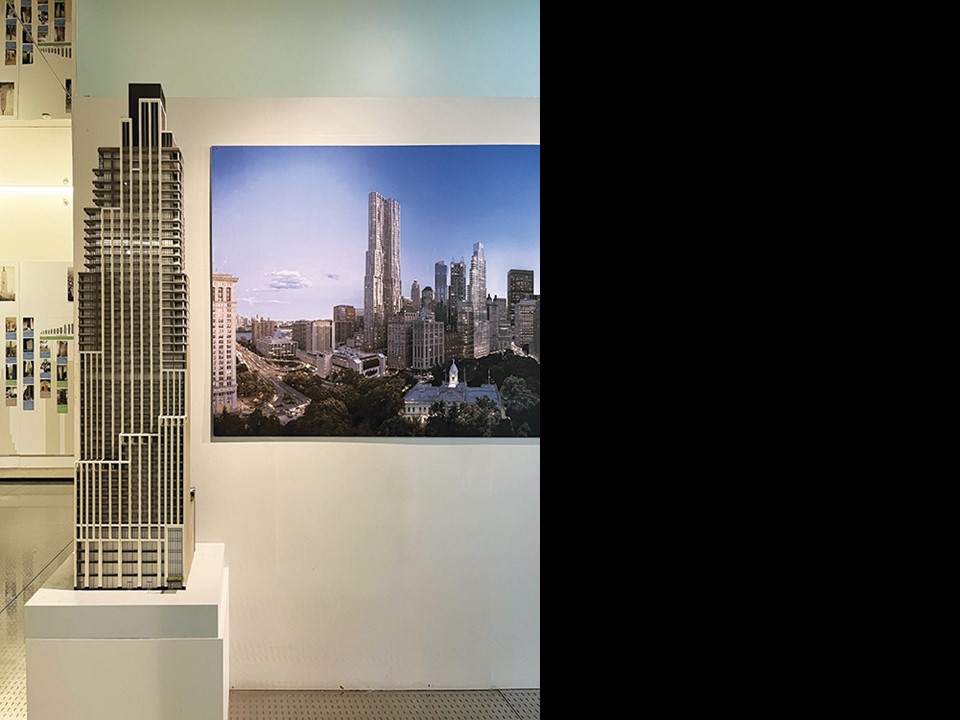
9. 25 Park Row 110 units 2020
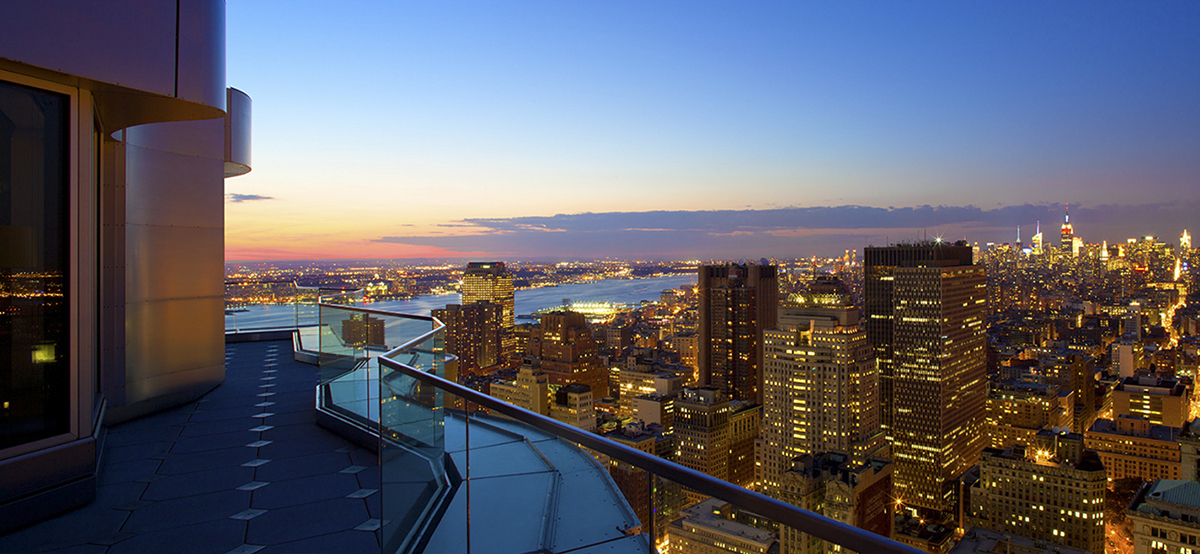
10. One Wall St. 566 units converted 2019
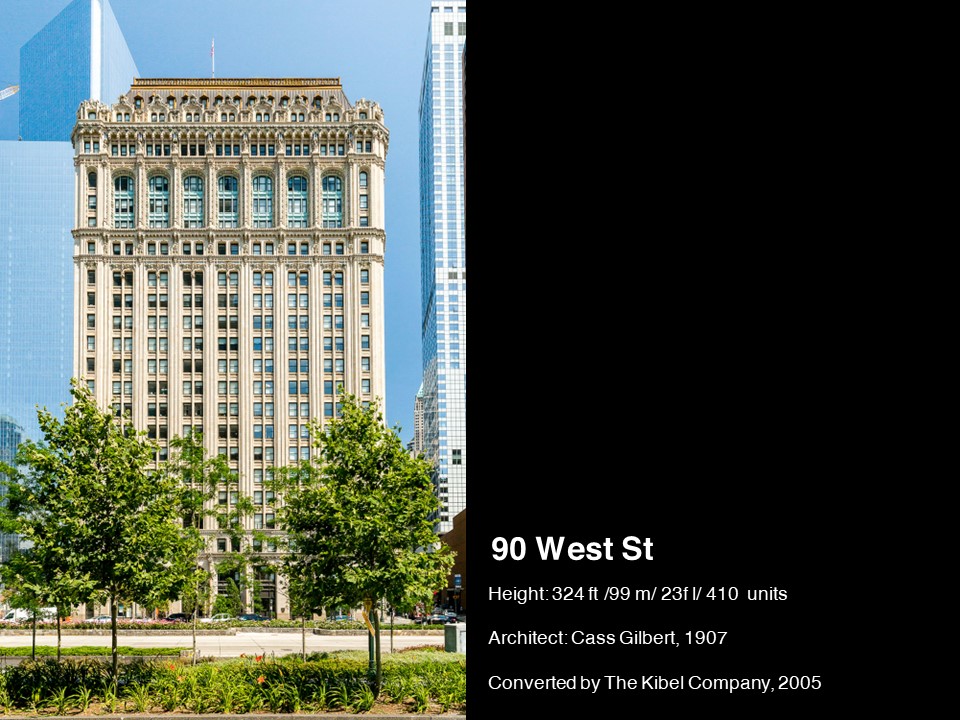
11. 90 West St. 410 units, RENTAL converted 2005
12. Woolworth Tower 34 units converted 2019

Largest Buildings
All are RENTAL and conversions, except 3 NEW.
A. 8 Spruce Street 904 units NEW 2011
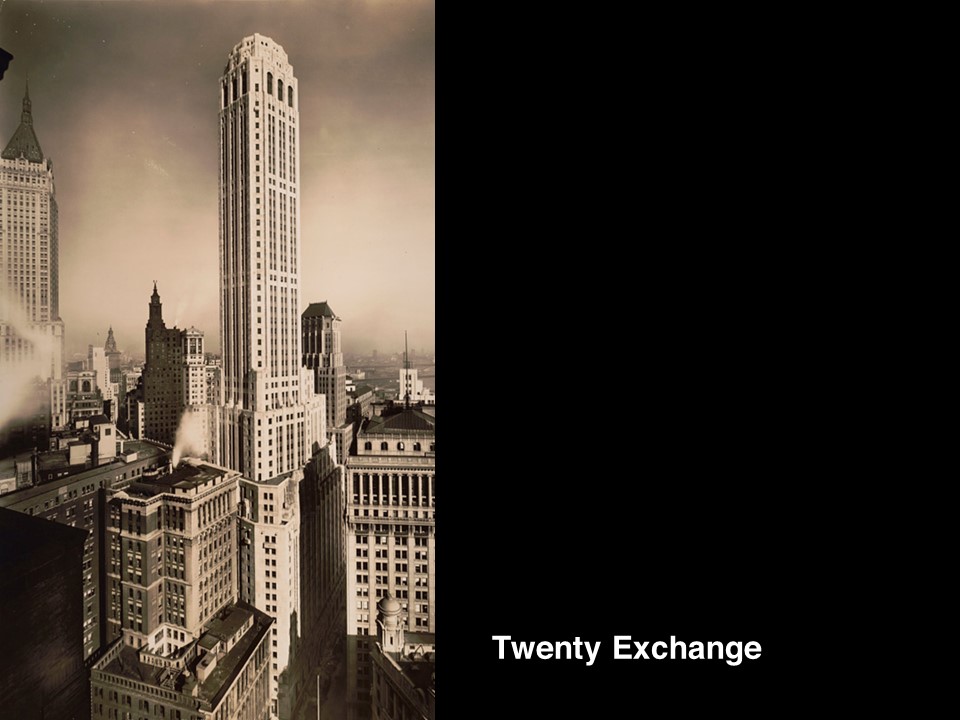
B. Twenty Exchange 720 units 2015
C. 2 Gold St. 650 units NEW 2005
D. 70 Pine 612 units 2015
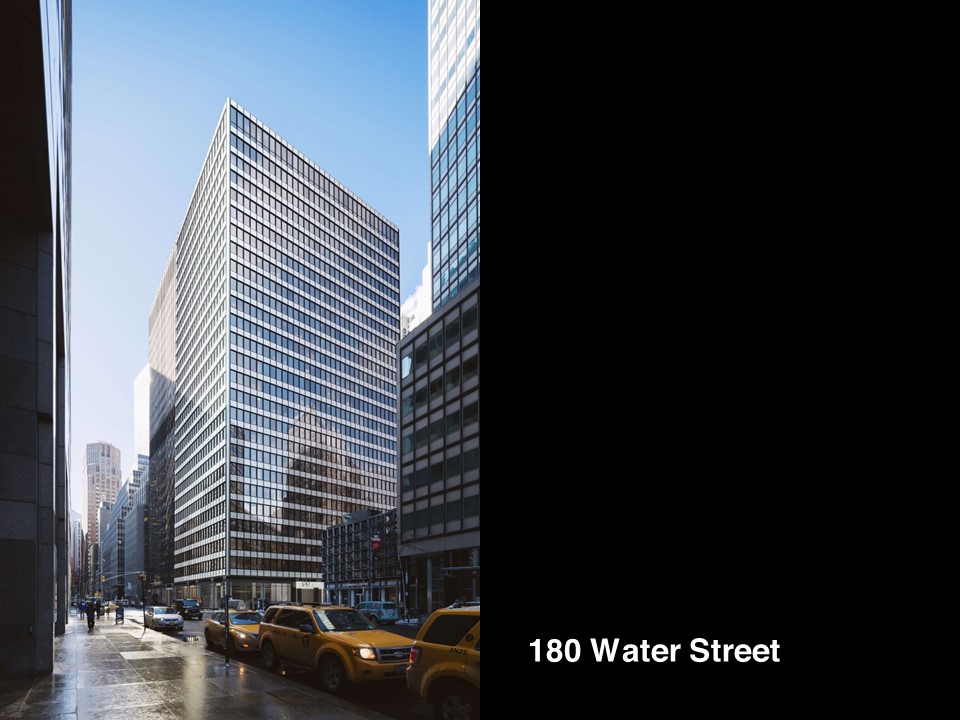
E. 180 Water 569 units 2017
F. One Wall Street 566 units 2019
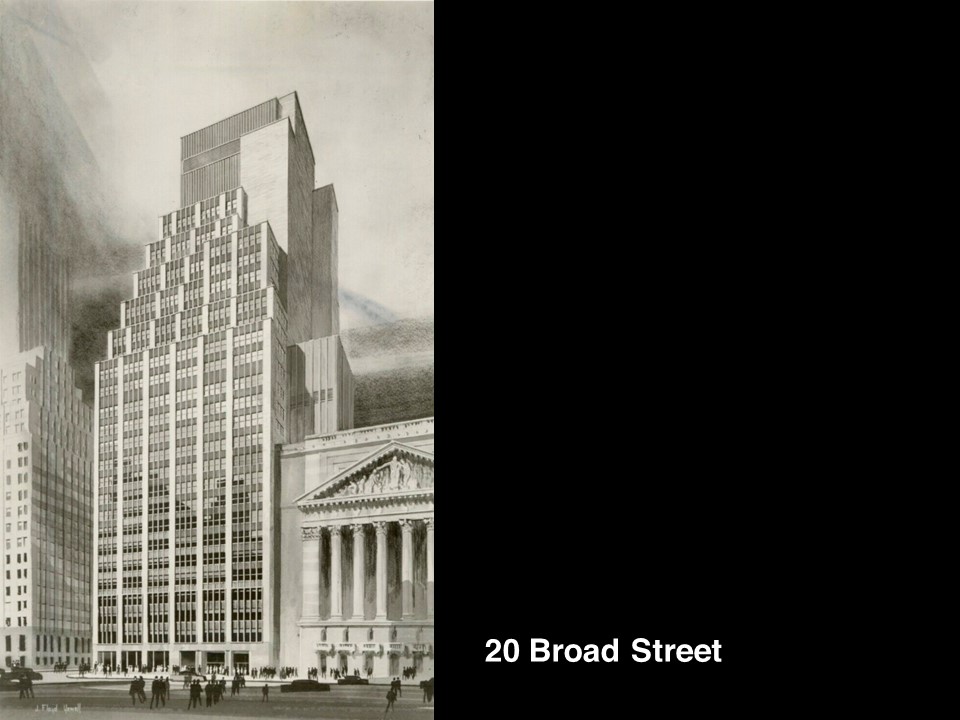
G. 20 Broad Street 533 units 2017
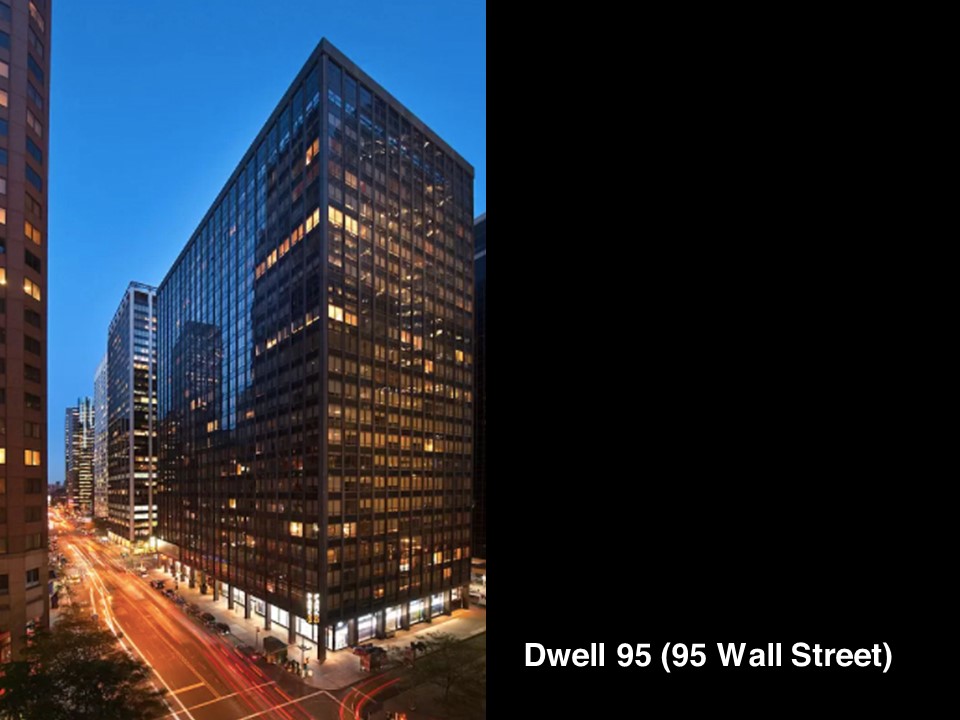
H. Dwell 95 507 units 2008
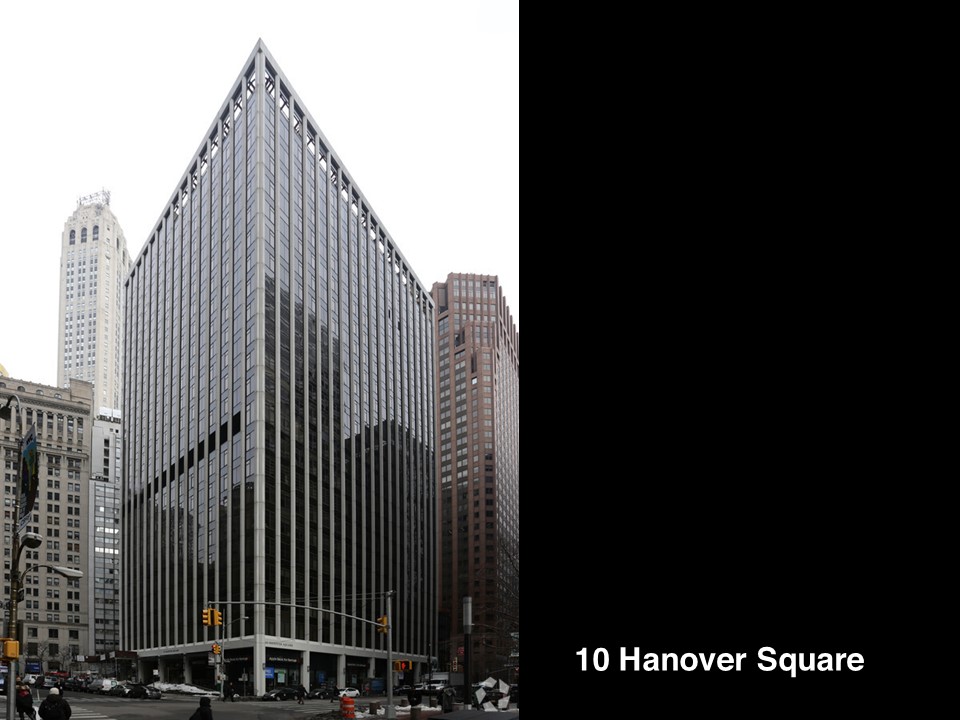
I. 10 Hanover Square 493 units 2005
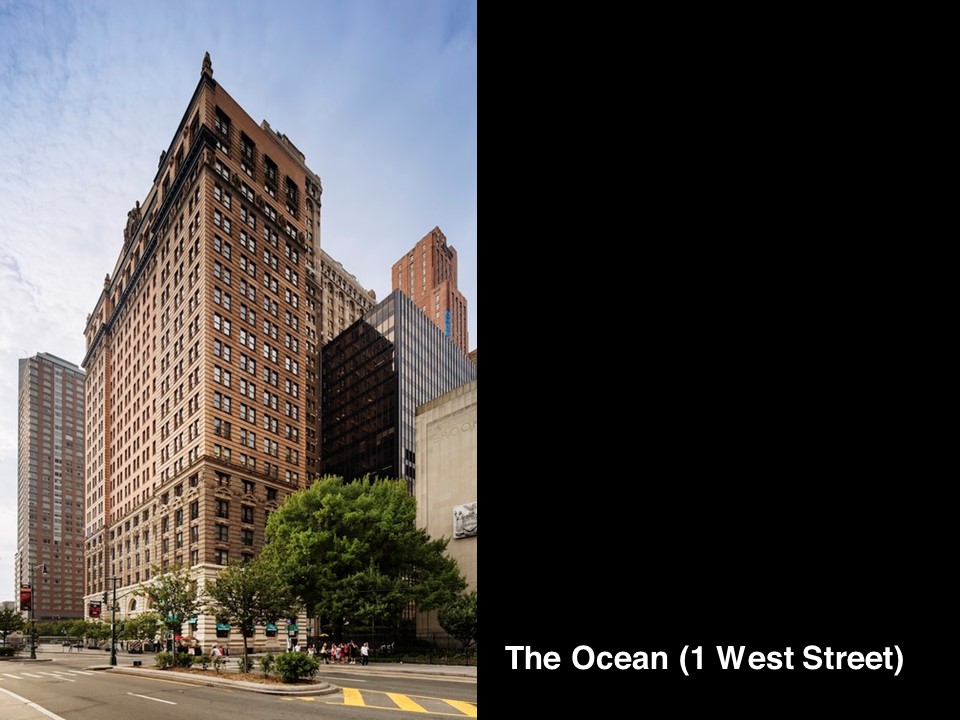
J. The Ocean 490 units 2001
K. 19 Dutch 483 units NEW 2018
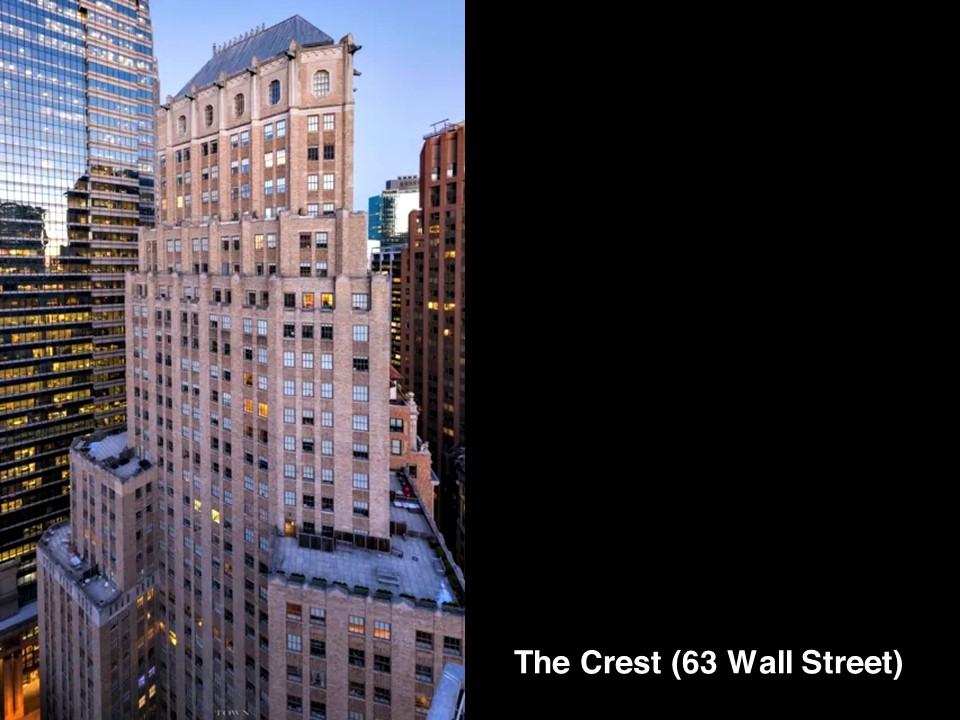
L. The Crest 476 units 2005

